
Observability of Trilio with Openshift Monitoring
Introduction
Prerequisites
Enabling User Workload Monitoring
1
2
Verify User Workload Monitoring is Running
oc get pods -n openshift-user-workload-monitoring
# Expected output:
# NAME READY STATUS RESTARTS AGE
# prometheus-operator-xxxxxxxxxx-xxxxx 2/2 Running 0 5m
# prometheus-user-workload-0 6/6 Running 0 5m
# prometheus-user-workload-1 6/6 Running 0 5m
# thanos-ruler-user-workload-0 4/4 Running 0 5m
# thanos-ruler-user-workload-1 4/4 Running 0 5m3
Enable Alertmanager and AlertmanagerConfig
Configure Cluster Monitoring (openshift-monitoring)
apiVersion: v1
kind: ConfigMap
metadata:
  name: cluster-monitoring-config
  namespace: openshift-monitoring
data:
  config.yaml: |
    enableUserWorkload: true
alertmanagerMain:
enableUserAlertmanagerConfig: trueoc apply -f cluster-monitoring-config.yamlConfigure User Workload Monitoring (openshift-user-workload-monitoring)
apiVersion: v1
kind: ConfigMap
metadata:
  name: user-workload-monitoring-config
  namespace: openshift-user-workload-monitoring
data:
  config.yaml: |
    alertmanager:
      enabled: true
enableAlertmanagerConfig: trueoc apply -f user-workload-monitoring-config.yamlConfiguration
Alertmanager Location
Use Case
4
Verify Alertmanager is Running
Platform Alertmanager (openshift-monitoring)
oc get pods -n openshift-monitoring -l app.kubernetes.io/name=alertmanager

# Expected output:
# NAME                   READY   STATUS    RESTARTS   AGE
# alertmanager-main-0    6/6     Running   0          5m
# alertmanager-main-1 6/6 Running 0 5m# Port-forward to access the UI
oc port-forward -n openshift-monitoring svc/alertmanager-main 9093:9093
# Open http://localhost:9093 in your browserUser Workload Alertmanager (openshift-user-workload-monitoring)
oc get pods -n openshift-user-workload-monitoring -l app.kubernetes.io/name=alertmanager

# Expected output:
# NAME                            READY   STATUS    RESTARTS   AGE
# alertmanager-user-workload-0    6/6     Running   0          5m
# alertmanager-user-workload-1 6/6 Running 0 5m# Port-forward to access the UI
oc port-forward -n openshift-user-workload-monitoring svc/alertmanager-user-workload 9093:9093
# Open http://localhost:9093 in your browserConfiguring T4K Metrics Collection
Option 1: Enable ServiceMonitor via TVM Custom Resource (Recommended)
Option 2: Create ServiceMonitor Manually
Verifying Metrics Collection
Configuring T4K Alerting Rules
T4K Alerting Rules
Verifying Alerting Rules
Configuring Alert Routing
Prerequisites for Alert Routing
Example: AlertmanagerConfig with Slack Notifications
Creating the Slack Webhook Secret
Example: AlertmanagerConfig with Email Notifications
Example: AlertmanagerConfig with PagerDuty
Custom Notification Templates
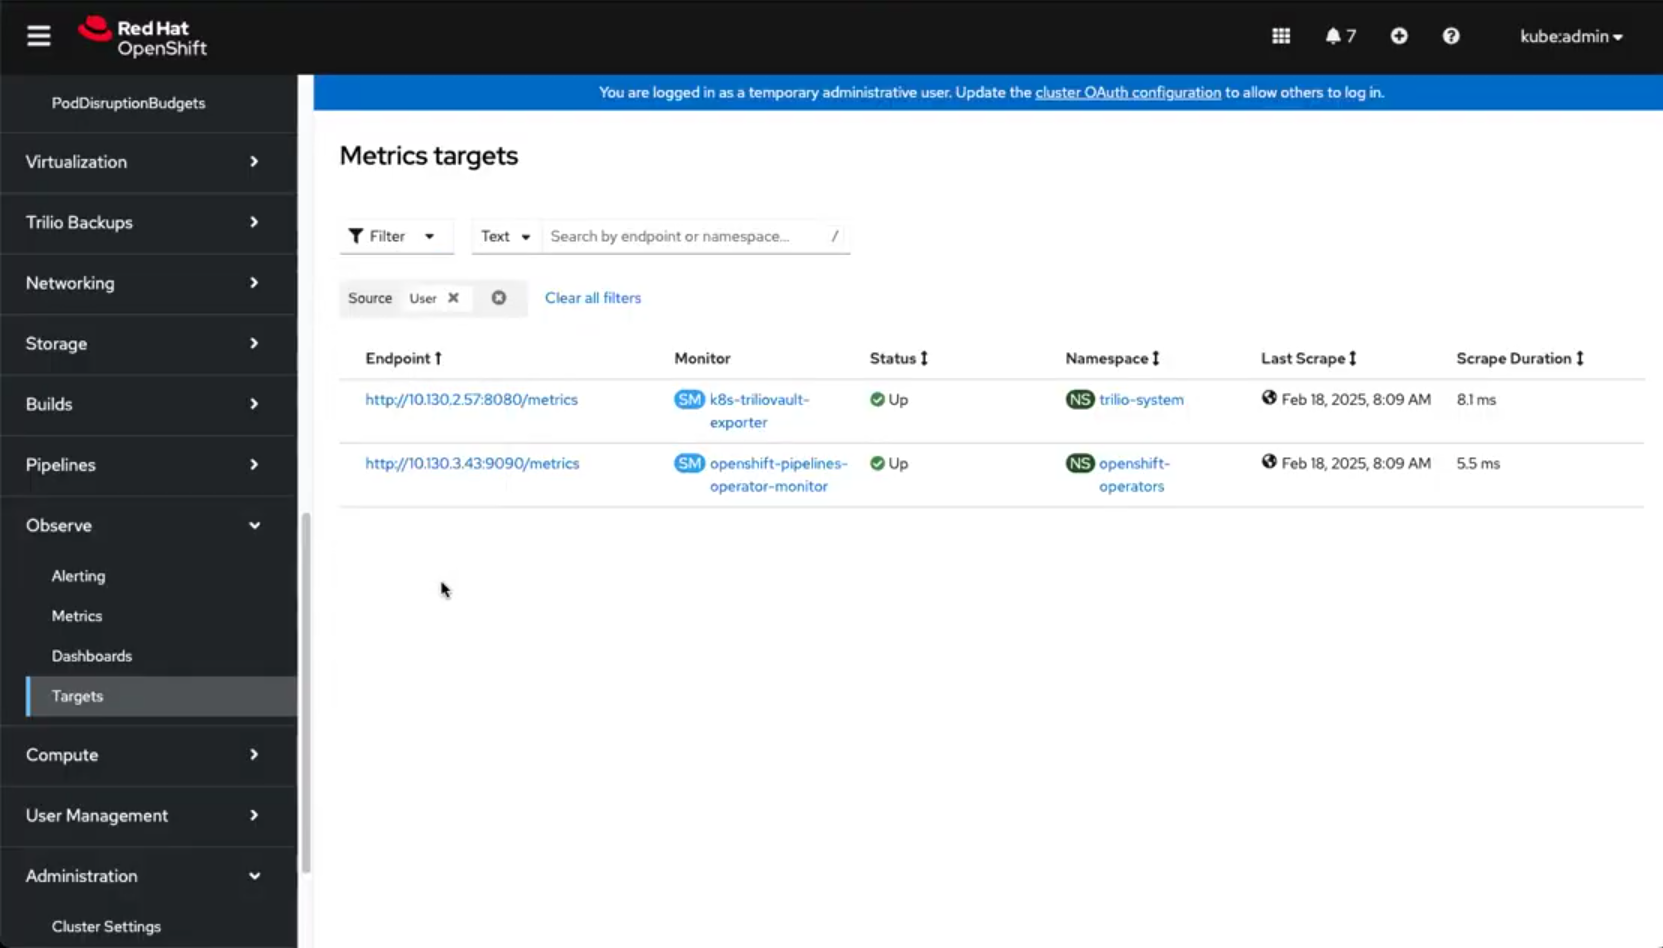
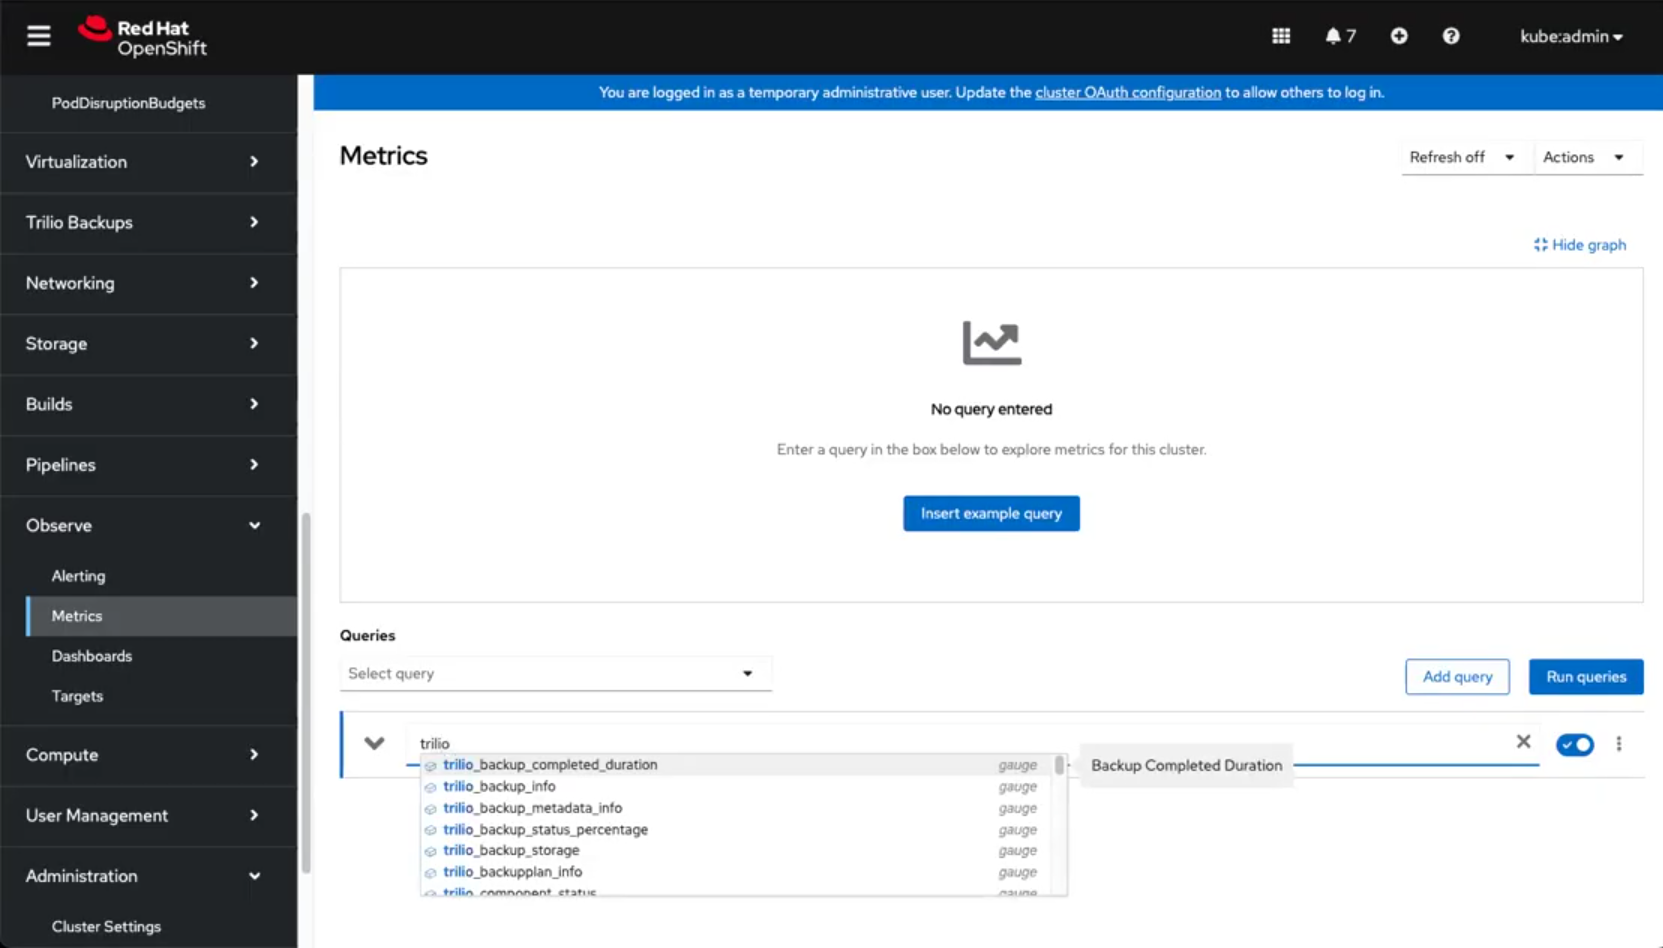
Viewing Metrics and Alerts in OpenShift Console
T4K Metrics Reference
Metric Value Conventions
Status
Metric Value
Description
Available Metrics
Backup Metrics
Metric Name
Description
Restore Metrics
Metric Name
Description
Target Metrics
Metric Name
Description
BackupPlan Metrics
Metric Name
Description
Continuous Restore Metrics
Metric Name
Description
Example PromQL Queries
Separating Platform and User Alerts
Troubleshooting
Metrics Not Appearing
Alerts Not Firing
Alert Notifications Not Received
Additional Resources
Last updated