Observability of Trilio with Prometheus and Grafana
Learn how to consume and visualize performance metrics from the Trilio Metrics Exporter for Prometheus.
About the Trilio Metrics Exporter for Prometheus
The Trilio Metrics Exporter is installed as a component of Trilio for Kubernetes. It is used to export Trilio performance metrics in the Prometheus format, consumable by your existing Prometheus monitoring. The exporter is based on the official Prometheus client library.
For details on the Prometheus formatted metrics provided by the Trilio Metrics Exporter, check the Exported Prometheus Metrics page.
In this How-to, we'll show you how you can consume performance metrics from the Trilio Metrics Exporter with your existing Prometheus installation.
In order to leverage the OpenShift built-in Prometheus instance hosted in the openshift-monitoring namespace, extra permissions will be required for the service account (openshift-monitoring:prometheus-k8s) to pull metrics from the openshift-operators namespace, where Trilio is deployed.
Consuming Metrics - Inside the Cluster
There are two methods to scrape the metrics from Trilio Exporter:
Using Annotations
Prometheus can discover any metric in the cluster exporter using the standard annotation set on the exporter pod.
The annotations are described below:
prometheus.io/scrape:The default configuration will scrape all pods; if set to false, this annotation will exclude the pod from the scraping process.prometheus.io/path:If the metrics path is not /metrics, define it with this annotation.prometheus.io/port:Scrape the pod on the indicated port instead of the pod’s declared ports; Here, it is 8080.
Trilio for Kubernetes has pre-configured the above annotations on the Metrics Exporter pod. If you have a cluster with Prometheus already installed and configured, then your Prometheus instance should start collecting Trilio for Kubernetes metrics without any configuration change.
Using Scrape Job
You will need to configure a Prometheus server to scrape the metrics from your newly running exporter. Add the following scrape job to your prometheus.yml configuration file.
EXPORTER_ADDRESS is the IP of the Prometheus exporter pod, which can be found by running the following
Using ServiceMonitor
Step 1: Expose Trilio Exporter: To expose the Trilio metrics, you need to create a Kubernetes Service. If your Prometheus setup is not present in this cluster, expose it via a LoadBalancer Service.
You can create a LoadBalancer Service using the following.YAML
Step 2. Create ServiceMonitor: You will need to configure a ServiceMonitor for Prometheus to scrape the metrics from your k8s-triliovault-exporter-service. Apply the following YAML to the namespace where T4K is installed.
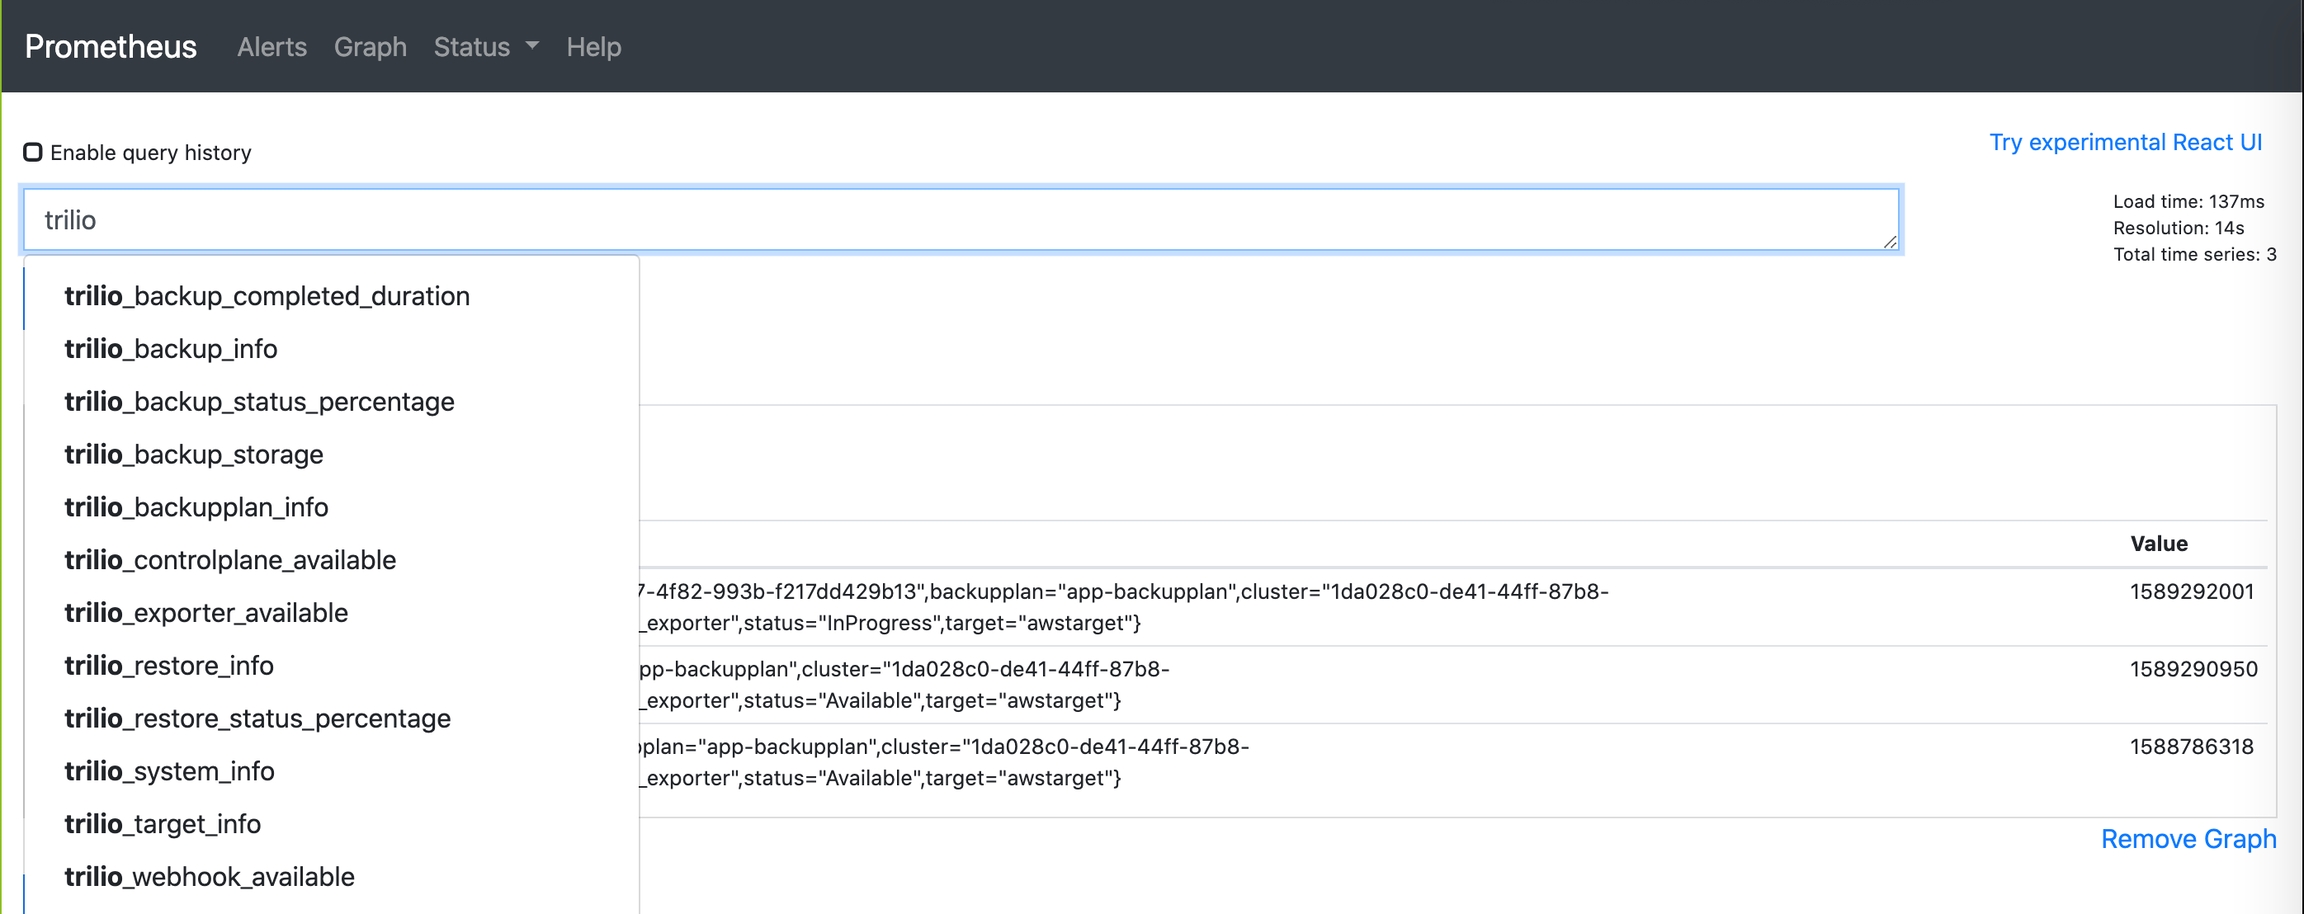
Once the configuration is completed. You can find k8s-triliovault-exporter active targets in Prometheus UI.
Please wait a couple of minutes for Prometheus to start scraping metrics. Access Prometheus console at http://<prometheus-server-ip>/graph

If you leverage the Prometheus Operator stack, configure the ServiceMonitor the same way as the above configurations.
Consuming Metrics - Outside the cluster
To expose T4K metrics outside the cluster, perform the following two steps.
Expose Trilio Exporter: Trilio metrics can be exposed outside the cluster via a LoadBalancer Service. Leverage kubectl to create a service for k8s-triliovault-exporter
OR you can create a LoadBalancer Service using a .yaml file
Once the Service is available, capture the Public IP for k8s-triliovault-exporter-service, this will be used in the second step.
Scrape Job: You will need to configure a Prometheus server to scrape the metrics from your newly running exporter. Add the following scrape job to your
prometheus.ymlconfiguration file.
Visualizing Metrics with Grafana
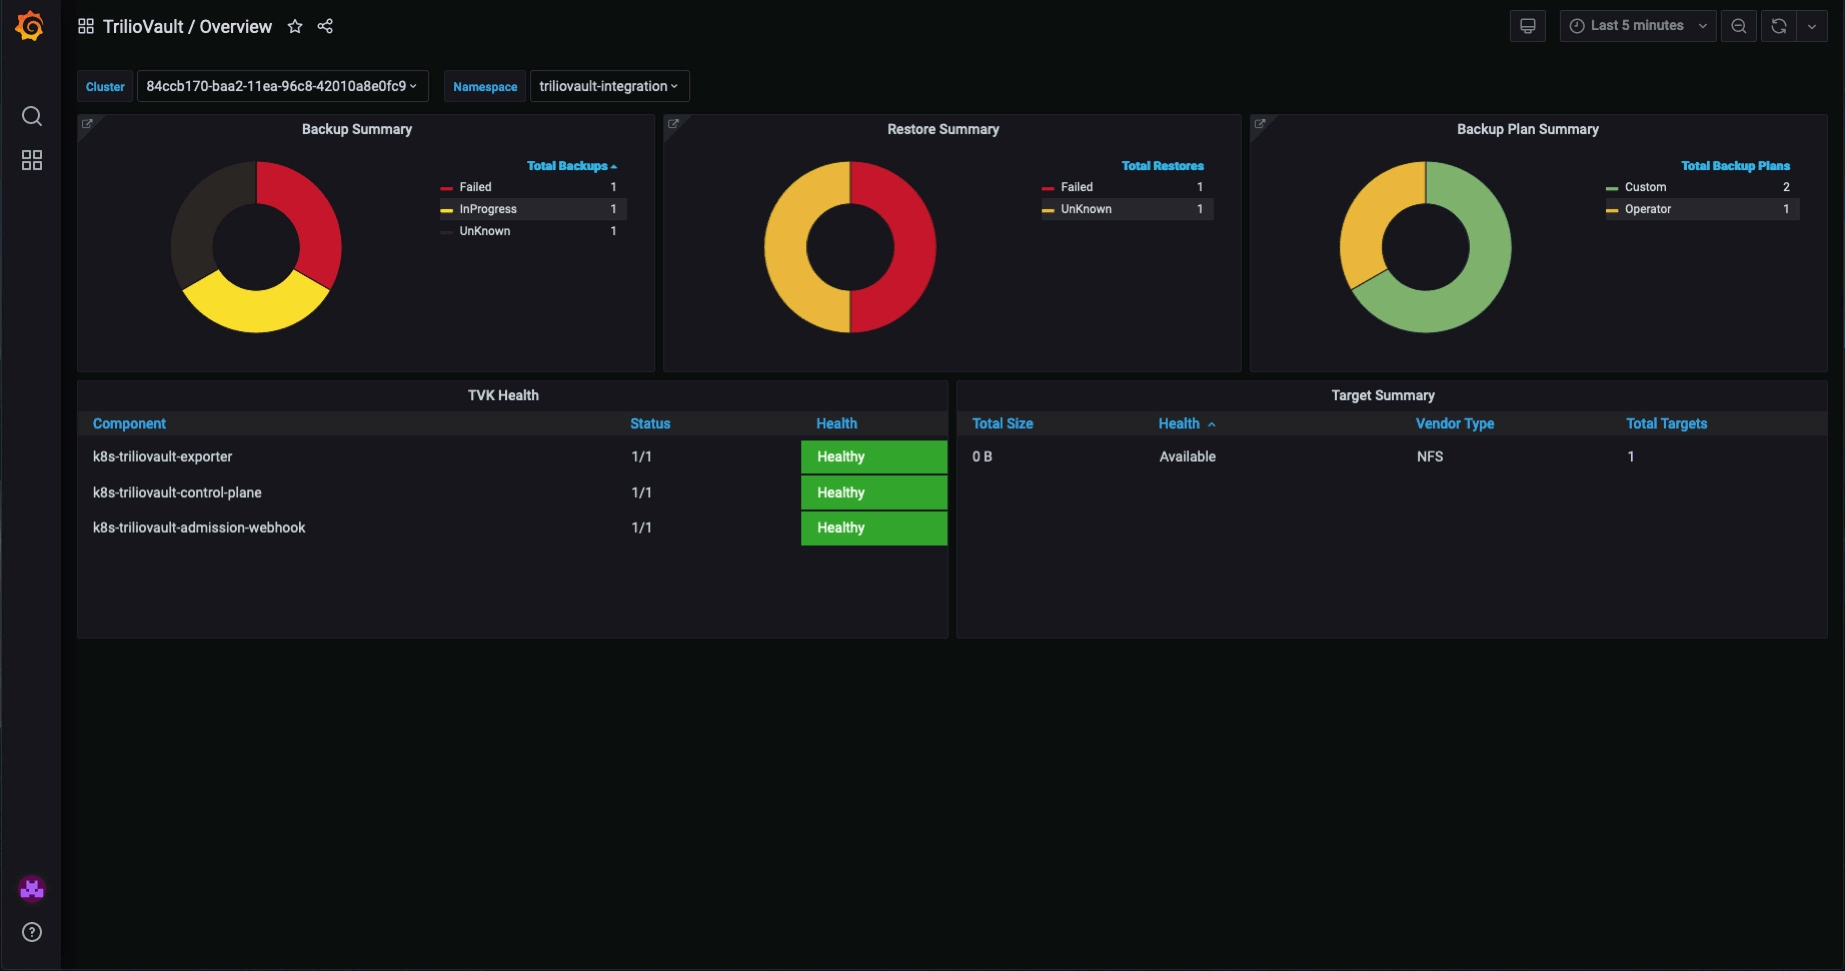
Metrics from Prometheus can be visualized leveraging Grafana. Dashboards can be created in Grafana with the Trilio metrics exposed through Prometheus.
Trilio Grafana Dashboards
Trilio provides pre-created Grafana dashboards to make monitoring and observing your backup landscape accessible.
Grafana dashboards are pivoted on the following themes and provide a high-level overview, summary, and details around each theme.
Backups
Restores
Targets
BackupPlans/Application
Import Grafana Dashboards
T4K dashboards can be found on the Grafana within the Trilio org page.
Please ensure that the dependencies mentioned for each dashboard are fulfilled. The T4K dashboards will not work as expected if these dependencies are unmet.
The dashboards can be imported into a Grafana instance following instructions from the Grafana project page.
Instructions for downloading and importing are provided with the dashboards.
