# T4K Integration with Observability Stack

## Introduction

The Observability Stack is a pre-packaged distribution for monitoring, logging, and dashboarding and can be installed into any existing Kubernetes cluster. It includes many of the most popular open-source observability tools with Prometheus, Grafana, Promtail\*\*,\*\* and Loki. The observability stack provides a straightforward, maintainable solution for analyzing server traffic and identifying potential deployment problems.

### T4K Installation with Observability using Trilio Operator

To install the operator with observability enabled, run the latest helm chart with the following parameter set.

```
helm repo add triliovault-operator https://charts.k8strilio.net/trilio-stable/k8s-triliovault-operator
helm install tvm triliovault-operator/k8s-triliovault-operator --set observability.enabled=true
```

### Observability Stack Configurable Parameters

The following table lists the configuration parameters of the observability stack

<table><thead><tr><th width="415">Parameter</th><th>Description</th><th>Default</th></tr></thead><tbody><tr><td><code>observability.enabled</code></td><td>observability stack is enabled</td><td>false</td></tr><tr><td><code>observability.name</code></td><td>observability name for T4K integration</td><td>tvk-integration</td></tr><tr><td><code>observability.logging.loki.enabled</code></td><td>logging stack, loki is enabled</td><td>true</td></tr><tr><td><code>observability.logging.loki.fullnameOverride</code></td><td>name of the loki service</td><td>"loki"</td></tr><tr><td><code>observability.logging.loki.singleBinary.persistence.enabled</code></td><td>loki persistence storage enabled</td><td>true</td></tr><tr><td><code>observability.logging.loki.singleBinary.persistence.accessModes</code></td><td>loki persistence storage accessModes</td><td>ReadWriteOnce</td></tr><tr><td><code>observability.logging.loki.singleBinary.persistence.size</code></td><td>loki persistence storage size</td><td>10Gi</td></tr><tr><td><code>observability.logging.loki.loki.limits_config.reject_old_samples_max_age</code></td><td>loki config, maximum accepted sample age before rejecting</td><td>168h</td></tr><tr><td><code>observability.logging.loki.tableManager.retention_period</code></td><td>loki config, how far back tables will be kept before they are deleted.<br>0s disables deletion.</td><td>168h</td></tr><tr><td><code>observability.logging.promtail.enabled</code></td><td>logging stack, promtail is enabled</td><td>true</td></tr><tr><td><code>observability.logging.promtail.fullnameOverride</code></td><td>name of the promtail service</td><td>"promtail"</td></tr><tr><td><code>observability.logging.promtail.config.clients.url</code></td><td>loki url for promtail integration</td><td>"<a href="http://loki:3100/loki/api/v1/push">http://loki:3100/loki/api/v1/push</a>"</td></tr><tr><td><code>observability.monitoring.prometheus.enabled</code></td><td>monitoring stack, prometheus is enabled</td><td>true</td></tr><tr><td><code>observability.monitoring.prometheus.fullnameOverride</code></td><td>name of the prometheus service</td><td>"prom"</td></tr><tr><td><code>observability.monitoring.prometheus.server.enabled</code></td><td>prometheus server is enabled</td><td>true</td></tr><tr><td><code>observability.monitoring.prometheus.server.fullnameOverride</code></td><td>name of prometheus server service</td><td>"prom-server"</td></tr><tr><td><code>observability.monitoring.prometheus.server.persistentVolume.enabled</code></td><td>prometheus server with persistent volume is enabled</td><td>false</td></tr><tr><td><code>observability.monitoring.prometheus.kube-state-metrics.enabled</code></td><td>prometheus kube state metrics is enabled</td><td>false</td></tr><tr><td><code>observability.monitoring.prometheus.prometheus-node-exporter.enabled</code></td><td>prometheus node exporter is enabled</td><td>false</td></tr><tr><td><code>observability.monitoring.prometheus.prometheus-pushgateway.enabled</code></td><td>prometheus push gateway is enabled</td><td>false</td></tr><tr><td><code>observability.monitoring.prometheus.alertmanager.enabled</code></td><td>prometheus alert manager is enabled</td><td>false</td></tr><tr><td><code>observability.visualization.grafana.enabled</code></td><td>visualization stack, grafana is enabled</td><td>true</td></tr><tr><td><code>observability.visualization.grafana.adminPassword</code></td><td>grafana password for admin user</td><td>"admin123"</td></tr><tr><td><code>observability.visualization.grafana.fullnameOverride</code></td><td>name of grafana service</td><td>"grafana"</td></tr><tr><td><code>observability.visualization.grafana.service.type</code></td><td>grafana service type</td><td>"ClusterIP"</td></tr></tbody></table>

Check the observability stack configuration by running the following command:

```
kubectl get pods -n <install_ns>

promtail-2zpcv                                              1/1     Running            0          2m16s
grafana-554cb4f55-q4q59                                     3/3     Running            0          2m15s
prom-server-786b8cf897-nglhh                                2/2     Running            0          2m15s
k8s-triliovault-operator-85dfc877b8-5xqx9                   1/1     Running            0          2m15s
loki-0                                                      1/1     Running            0          2m15s
k8s-triliovault-admission-webhook-96db687bb-wnfh7           1/1     Running            0          62s
k8s-triliovault-control-plane-6b986c8fb9-zjbnj              2/2     Running            0          62s
k8s-triliovault-exporter-7b98cb7678-wxwvx                   1/1     Running            0          62s
k8s-triliovault-ingress-nginx-controller-57b777f45b-dnjkv   1/1     Running            0          62s
k8s-triliovault-web-85c79c9c4f-djqqz                        1/1     Running            0          62s
k8s-triliovault-web-backend-5c8c67c548-pcgvl                1/1     Running            0          62s
```

## Enabling ServiceMonitor for T4K Metrics

The T4K exporter exposes Prometheus metrics on port 8080. You can enable a ServiceMonitor for automatic metrics discovery by Prometheus.

### Enabling ServiceMonitor via Helm

Enable ServiceMonitor during T4K installation or upgrade:

```bash
# New installation with ServiceMonitor enabled
helm install tvm triliovault-operator/k8s-triliovault-operator \
  --set observability.enabled=true \
  --set installTVK.exporter.serviceMonitor.enabled=true
```

Or upgrade an existing installation:

```bash
helm upgrade tvm triliovault-operator/k8s-triliovault-operator \
  --set installTVK.exporter.serviceMonitor.enabled=true \
  --reuse-values
```

### ServiceMonitor Configuration Parameters

<table><thead><tr><th width="402">Parameter</th><th>Description</th><th>Default</th></tr></thead><tbody><tr><td><code>installTVK.exporter.enabled</code></td><td>Enable/disable the metrics exporter</td><td><code>true</code></td></tr><tr><td><code>installTVK.exporter.serviceMonitor.enabled</code></td><td>Enable Prometheus ServiceMonitor for metrics collection</td><td><code>false</code></td></tr><tr><td><code>installTVK.exporter.resources.requests.cpu</code></td><td>CPU request for exporter pod</td><td><code>50m</code></td></tr><tr><td><code>installTVK.exporter.resources.requests.memory</code></td><td>Memory request for exporter pod</td><td><code>512Mi</code></td></tr></tbody></table>

When ServiceMonitor is enabled, the Helm chart creates:

* A **Service** exposing the exporter metrics on port 8080
* A **ServiceMonitor** resource that configures Prometheus to scrape metrics from the exporter

{% hint style="info" %}
When `exporter.serviceMonitor.enabled` is set to `false` (default), the exporter pod includes Prometheus scrape annotations:

* `prometheus.io/scrape: "true"`
* `prometheus.io/path: /metrics`
* `prometheus.io/port: "8080"`

If your Prometheus is configured to discover targets via pod annotations, metrics will be collected automatically without a ServiceMonitor.
{% endhint %}

### Verifying Metrics Collection

After enabling the ServiceMonitor, verify that Prometheus is scraping T4K metrics:

1. Access Prometheus or Grafana UI
2. Query for T4K metrics:

   ```promql
   trilio_backup_info
   ```
3. You should see metrics with labels like `backup`, `backupplan`, `resource_namespace`, etc.

## Alertmanager Configuration

Alertmanager handles alerts sent by Prometheus server and manages routing, grouping, and notification. The observability stack includes Alertmanager as a sub-chart that can be enabled for T4K monitoring.

### Enabling Alertmanager

To enable Alertmanager with the observability stack, set the following parameter during installation:

```bash
helm install tvm triliovault-operator/k8s-triliovault-operator \
  --set observability.enabled=true \
  --set observability.monitoring.prometheus.alertmanager.enabled=true
```

### Alertmanager Configurable Parameters

The following table lists the Alertmanager-specific configuration parameters:

| Parameter                                                                           | Description                                    | Default                                                |
| ----------------------------------------------------------------------------------- | ---------------------------------------------- | ------------------------------------------------------ |
| `observability.monitoring.prometheus.alertmanager.enabled`                          | Enable Alertmanager                            | false                                                  |
| `observability.monitoring.prometheus.alertmanager.image.repository`                 | Alertmanager container image repository        | quay.io/prometheus/alertmanager                        |
| `observability.monitoring.prometheus.alertmanager.configmapReload.image.repository` | Alertmanager configmap reload image repository | quay.io/prometheus-operator/prometheus-config-reloader |
| `observability.monitoring.prometheus.alertmanager.replicaCount`                     | Number of Alertmanager replicas                | 1                                                      |
| `observability.monitoring.prometheus.alertmanager.persistence.enabled`              | Enable persistent storage for Alertmanager     | true                                                   |
| `observability.monitoring.prometheus.alertmanager.persistence.size`                 | Alertmanager persistent volume size            | 50Mi                                                   |
| `observability.monitoring.prometheus.alertmanager.persistence.accessModes`          | Alertmanager persistent volume access modes    | ReadWriteOnce                                          |
| `observability.monitoring.prometheus.alertmanager.service.type`                     | Alertmanager service type                      | ClusterIP                                              |
| `observability.monitoring.prometheus.alertmanager.service.port`                     | Alertmanager service port                      | 9093                                                   |
| `observability.monitoring.prometheus.alertmanager.ingress.enabled`                  | Enable ingress for Alertmanager                | false                                                  |

### Minimal Alertmanager Configuration

The following is a minimal Alertmanager configuration sample with basic routing:

```yaml
# alertmanager-minimal-values.yaml
observability:
  enabled: true
  monitoring:
    prometheus:
      alertmanager:
        enabled: true

        # Basic configuration
        replicaCount: 1

        persistence:
          enabled: true
          size: 50Mi

        service:
          type: ClusterIP
          port: 9093

        # Alertmanager configuration
        config:
          enabled: true

          global:
            resolve_timeout: 5m

          # Notification templates path
          templates:
            - '/etc/alertmanager/*.tmpl'

          # Define receivers (notification endpoints)
          receivers:
            - name: 'default-receiver'
              # Empty receiver - alerts go here but no notifications sent

            - name: 'null'
              # Explicitly ignore alerts

          # Routing tree
          route:
            # Default receiver
            receiver: 'default-receiver'

            # How long to wait before sending notification for a group
            group_wait: 30s

            # How long to wait before sending updated notification
            group_interval: 5m

            # How long to wait before re-sending notification
            repeat_interval: 4h

            # Group alerts by these labels
            group_by: ['alertname', 'namespace', 'severity']

            # Child routes (optional)
            routes:
              # Silence watchdog alerts
              - match:
                  alertname: Watchdog
                receiver: 'null'

          # Inhibition rules (optional)
          # Mute less severe alerts when critical ones are firing
          inhibit_rules:
            - source_match:
                severity: 'critical'
              target_match:
                severity: 'warning'
              equal: ['alertname', 'namespace']
```

Install with:

```bash
helm install tvm triliovault-operator/k8s-triliovault-operator -f alertmanager-minimal-values.yaml
```

### Example: Alertmanager with Slack Notifications

The following example demonstrates how to configure Alertmanager to send alerts to a Slack channel:

```yaml
# alertmanager-values.yaml
observability:
  enabled: true
  monitoring:
    prometheus:
      enabled: true
      alertmanager:
        enabled: true
        persistence:
          enabled: true
          size: 100Mi
        config:
          enabled: true
          global:
            slack_api_url: 'https://hooks.slack.com/services/YOUR/SLACK/WEBHOOK'
          receivers:
            - name: 'slack-notifications'
              slack_configs:
                - channel: '#alerts'
                  send_resolved: true
                  title: '{{ template "slack.default.title" . }}'
                  text: '{{ template "slack.default.text" . }}'
            - name: 'default-receiver'
          route:
            group_by: ['alertname', 'namespace']
            group_wait: 30s
            group_interval: 5m
            repeat_interval: 4h
            receiver: 'default-receiver'
            routes:
              - match:
                  severity: critical
                receiver: 'slack-notifications'
```

Install with the custom values file:

```bash
helm install tvm triliovault-operator/k8s-triliovault-operator -f alertmanager-values.yaml
```

### Example: Alertmanager with Email Notifications

The following example demonstrates how to configure Alertmanager to send alerts via email:

```yaml
# alertmanager-email-values.yaml
observability:
  enabled: true
  monitoring:
    prometheus:
      enabled: true
      alertmanager:
        enabled: true
        persistence:
          enabled: true
          size: 100Mi
        config:
          enabled: true
          global:
            smtp_smarthost: 'smtp.example.com:587'
            smtp_from: 'alertmanager@example.com'
            smtp_auth_username: 'alertmanager@example.com'
            smtp_auth_password: 'your-smtp-password'
          receivers:
            - name: 'email-notifications'
              email_configs:
                - to: 'team@example.com'
                  send_resolved: true
            - name: 'default-receiver'
          route:
            group_by: ['alertname', 'namespace']
            group_wait: 30s
            group_interval: 5m
            repeat_interval: 4h
            receiver: 'default-receiver'
            routes:
              - match:
                  severity: critical
                receiver: 'email-notifications'
```

### Example: Alertmanager with PagerDuty Integration

The following example demonstrates how to configure Alertmanager with PagerDuty for incident management:

```yaml
# alertmanager-pagerduty-values.yaml
observability:
  enabled: true
  monitoring:
    prometheus:
      enabled: true
      alertmanager:
        enabled: true
        persistence:
          enabled: true
          size: 100Mi
        config:
          enabled: true
          receivers:
            - name: 'pagerduty-critical'
              pagerduty_configs:
                - service_key: 'YOUR_PAGERDUTY_SERVICE_KEY'
                  severity: 'critical'
            - name: 'default-receiver'
          route:
            group_by: ['alertname', 'namespace', 'job']
            group_wait: 30s
            group_interval: 5m
            repeat_interval: 4h
            receiver: 'default-receiver'
            routes:
              - match:
                  severity: critical
                receiver: 'pagerduty-critical'
```

### Example: Alertmanager with Custom Templates

Alertmanager templates allow you to customize the format and content of notifications. The following example demonstrates how to create custom templates for T4K alerts:

```yaml
# alertmanager-templates-values.yaml
observability:
  enabled: true
  monitoring:
    prometheus:
      enabled: true
      alertmanager:
        enabled: true
        persistence:
          enabled: true
          size: 100Mi

        # Custom notification templates
        templates:
          t4k-alerts.tmpl: |-
            {{ define "t4k.title" -}}
            [{{ .Status | toUpper }}{{ if eq .Status "firing" }}:{{ .Alerts.Firing | len }}{{ end }}] {{ .CommonLabels.alertname }}
            {{- end }}

            {{ define "t4k.text" -}}
            {{ range .Alerts }}
            *Alert:* {{ .Labels.alertname }}
            *Severity:* {{ .Labels.severity }}
            *Status:* {{ .Status }}
            *Namespace:* {{ .Labels.namespace }}
            *Summary:* {{ .Annotations.summary }}
            *Description:* {{ .Annotations.description }}
            *Started:* {{ .StartsAt.Format "2006-01-02 15:04:05 MST" }}
            {{ if .EndsAt }}*Ended:* {{ .EndsAt.Format "2006-01-02 15:04:05 MST" }}{{ end }}
            ---
            {{ end }}
            {{- end }}

            {{ define "t4k.slack.title" -}}
            {{ if eq .Status "firing" }}[FIRING]{{ else }}[RESOLVED]{{ end }} {{ template "t4k.title" . }}
            {{- end }}

            {{ define "t4k.slack.text" -}}
            {{ if eq .Status "firing" }}
            *FIRING ALERTS:*
            {{ range .Alerts.Firing }}
            - *{{ .Labels.alertname }}* ({{ .Labels.severity }})
              Namespace: `{{ .Labels.namespace }}`
              {{ .Annotations.summary }}
            {{ end }}
            {{ end }}
            {{ if .Alerts.Resolved }}
            *RESOLVED ALERTS:*
            {{ range .Alerts.Resolved }}
            - *{{ .Labels.alertname }}* - {{ .Annotations.summary }}
            {{ end }}
            {{ end }}
            {{- end }}

            {{ define "t4k.email.subject" -}}
            [{{ .Status | toUpper }}] TrilioVault Alert: {{ .CommonLabels.alertname }}
            {{- end }}

            {{ define "t4k.email.html" -}}
            <!DOCTYPE html>
            <html>
            <head>
              <style>
                body { font-family: Arial, sans-serif; }
                .alert { padding: 10px; margin: 10px 0; border-radius: 5px; }
                .firing { background-color: #ffebee; border-left: 4px solid #f44336; }
                .resolved { background-color: #e8f5e9; border-left: 4px solid #4caf50; }
                .label { font-weight: bold; color: #333; }
              </style>
            </head>
            <body>
              <h2>TrilioVault Alert Notification</h2>
              {{ range .Alerts }}
              <div class="alert {{ .Status }}">
                <p><span class="label">Alert:</span> {{ .Labels.alertname }}</p>
                <p><span class="label">Severity:</span> {{ .Labels.severity }}</p>
                <p><span class="label">Status:</span> {{ .Status }}</p>
                <p><span class="label">Namespace:</span> {{ .Labels.namespace }}</p>
                <p><span class="label">Summary:</span> {{ .Annotations.summary }}</p>
                <p><span class="label">Description:</span> {{ .Annotations.description }}</p>
              </div>
              {{ end }}
            </body>
            </html>
            {{- end }}

        config:
          enabled: true
          global:
            slack_api_url: 'https://hooks.slack.com/services/YOUR/SLACK/WEBHOOK'

          templates:
            - '/etc/alertmanager/*.tmpl'

          receivers:
            - name: 'default-receiver'
            - name: 'slack-t4k-alerts'
              slack_configs:
                - channel: '#t4k-alerts'
                  send_resolved: true
                  title: '{{ template "t4k.slack.title" . }}'
                  text: '{{ template "t4k.slack.text" . }}'
                  color: '{{ if eq .Status "firing" }}danger{{ else }}good{{ end }}'
            - name: 'email-t4k-alerts'
              email_configs:
                - to: 'backup-team@example.com'
                  send_resolved: true
                  headers:
                    Subject: '{{ template "t4k.email.subject" . }}'
                  html: '{{ template "t4k.email.html" . }}'

          route:
            group_by: ['alertname', 'namespace']
            group_wait: 30s
            group_interval: 5m
            repeat_interval: 4h
            receiver: 'default-receiver'
            routes:
              - match:
                  severity: critical
                receiver: 'slack-t4k-alerts'
                continue: true
              - match:
                  severity: critical
                receiver: 'email-t4k-alerts'
```

#### Template Functions Reference

The following template functions are commonly used in Alertmanager templates:

| Function       | Description                        | Example                                                |
| -------------- | ---------------------------------- | ------------------------------------------------------ |
| `toUpper`      | Converts string to uppercase       | `{{ .Status \| toUpper }}`                             |
| `toLower`      | Converts string to lowercase       | `{{ .Labels.severity \| toLower }}`                    |
| `title`        | Converts string to title case      | `{{ .Labels.alertname \| title }}`                     |
| `join`         | Joins list elements with separator | `{{ .Labels.Values \| join ", " }}`                    |
| `safeHtml`     | Marks string as safe HTML          | `{{ .Annotations.description \| safeHtml }}`           |
| `reReplaceAll` | Regex replace                      | `{{ reReplaceAll "(.*):(.*)" "$1" .Labels.instance }}` |

#### Template Variables

Common variables available in templates:

| Variable             | Description                           |
| -------------------- | ------------------------------------- |
| `.Status`            | Alert status ("firing" or "resolved") |
| `.Alerts`            | List of all alerts in the group       |
| `.Alerts.Firing`     | List of currently firing alerts       |
| `.Alerts.Resolved`   | List of resolved alerts               |
| `.CommonLabels`      | Labels common to all alerts           |
| `.CommonAnnotations` | Annotations common to all alerts      |
| `.ExternalURL`       | URL to Alertmanager                   |
| `.GroupLabels`       | Labels used for grouping              |

### Example: Using Kubernetes Secrets for Credentials

For production environments, it's recommended to store sensitive credentials (like Slack webhook URLs, SMTP passwords, or PagerDuty keys) in Kubernetes Secrets instead of hardcoding them in helm values.

#### Step 1: Create Kubernetes Secret

First, create a secret containing your sensitive credentials:

```bash
# Create secret with Slack webhook URL
kubectl create secret generic alertmanager-secrets \
  --namespace=<install_ns> \
  --from-literal=slack-webhook-url='https://hooks.slack.com/services/YOUR/SLACK/WEBHOOK' \
  --from-literal=smtp-password='your-smtp-password' \
  --from-literal=pagerduty-key='YOUR_PAGERDUTY_SERVICE_KEY'
```

Or using a YAML manifest:

```yaml
# alertmanager-secrets.yaml
apiVersion: v1
kind: Secret
metadata:
  name: alertmanager-secrets
  namespace: <install_ns>
type: Opaque
stringData:
  slack-webhook-url: "https://hooks.slack.com/services/YOUR/SLACK/WEBHOOK"
  smtp-password: "your-smtp-password"
  pagerduty-key: "YOUR_PAGERDUTY_SERVICE_KEY"
  smtp-auth-identity: "alertmanager@example.com"
```

Apply the secret:

```bash
kubectl apply -f alertmanager-secrets.yaml
```

#### Step 2: Configure Alertmanager to Use Secret

Configure Alertmanager to mount the secret and reference credentials from environment variables or files:

```yaml
# alertmanager-with-secrets-values.yaml
observability:
  enabled: true
  monitoring:
    prometheus:
      enabled: true
      alertmanager:
        enabled: true
        persistence:
          enabled: true
          size: 100Mi

        # Mount the secret as environment variables
        extraEnv:
          - name: SLACK_WEBHOOK_URL
            valueFrom:
              secretKeyRef:
                name: alertmanager-secrets
                key: slack-webhook-url
          - name: SMTP_PASSWORD
            valueFrom:
              secretKeyRef:
                name: alertmanager-secrets
                key: smtp-password
          - name: PAGERDUTY_KEY
            valueFrom:
              secretKeyRef:
                name: alertmanager-secrets
                key: pagerduty-key

        # Alternatively, mount secret as files
        extraSecretMounts:
          - name: alertmanager-secrets
            mountPath: /etc/alertmanager/secrets
            secretName: alertmanager-secrets
            readOnly: true

        config:
          enabled: true
          global:
            # Reference Slack webhook from environment variable
            slack_api_url_file: '/etc/alertmanager/secrets/slack-webhook-url'

            # SMTP configuration with password from secret
            smtp_smarthost: 'smtp.example.com:587'
            smtp_from: 'alertmanager@example.com'
            smtp_auth_username: 'alertmanager@example.com'
            smtp_auth_password_file: '/etc/alertmanager/secrets/smtp-password'

          receivers:
            - name: 'default-receiver'
            - name: 'slack-notifications'
              slack_configs:
                - channel: '#alerts'
                  send_resolved: true
                  # api_url can also be set per-receiver using file reference
                  api_url_file: '/etc/alertmanager/secrets/slack-webhook-url'
            - name: 'pagerduty-notifications'
              pagerduty_configs:
                - service_key_file: '/etc/alertmanager/secrets/pagerduty-key'
                  severity: 'critical'
            - name: 'email-notifications'
              email_configs:
                - to: 'team@example.com'
                  send_resolved: true

          route:
            group_by: ['alertname', 'namespace']
            group_wait: 30s
            group_interval: 5m
            repeat_interval: 4h
            receiver: 'default-receiver'
            routes:
              - match:
                  severity: critical
                receiver: 'slack-notifications'
                continue: true
              - match:
                  severity: critical
                receiver: 'pagerduty-notifications'
              - match:
                  severity: warning
                receiver: 'email-notifications'
```

#### Secret File Reference Options

Alertmanager supports `_file` suffix for many credential fields, which reads the value from a file:

| Original Field       | File Reference Field      | Description                    |
| -------------------- | ------------------------- | ------------------------------ |
| `slack_api_url`      | `slack_api_url_file`      | Global Slack webhook URL       |
| `api_url`            | `api_url_file`            | Per-receiver Slack webhook URL |
| `smtp_auth_password` | `smtp_auth_password_file` | SMTP password                  |
| `smtp_auth_identity` | `smtp_auth_identity_file` | SMTP identity                  |
| `smtp_auth_secret`   | `smtp_auth_secret_file`   | SMTP secret                    |
| `service_key`        | `service_key_file`        | PagerDuty service key          |
| `routing_key`        | `routing_key_file`        | PagerDuty routing key          |
| `token`              | `token_file`              | Opsgenie/VictorOps token       |
| `url`                | `url_file`                | Webhook URL                    |

#### Example: Complete Setup with External Secrets Operator

For organizations using External Secrets Operator (ESO) to sync secrets from external secret managers (AWS Secrets Manager, HashiCorp Vault, etc.):

```yaml
# external-secret.yaml
apiVersion: external-secrets.io/v1beta1
kind: ExternalSecret
metadata:
  name: alertmanager-secrets
  namespace: <install_ns>
spec:
  refreshInterval: 1h
  secretStoreRef:
    name: aws-secrets-manager
    kind: ClusterSecretStore
  target:
    name: alertmanager-secrets
    creationPolicy: Owner
  data:
    - secretKey: slack-webhook-url
      remoteRef:
        key: /production/alertmanager/slack-webhook
    - secretKey: smtp-password
      remoteRef:
        key: /production/alertmanager/smtp-password
    - secretKey: pagerduty-key
      remoteRef:
        key: /production/alertmanager/pagerduty-key
```

Apply the ExternalSecret:

```bash
kubectl apply -f external-secret.yaml
```

The External Secrets Operator will automatically create and sync the `alertmanager-secrets` Kubernetes Secret from your external secret manager.

{% hint style="warning" %}
**Security Best Practices:**

* Never commit secrets to version control
* Use `_file` references instead of inline credentials
* Rotate secrets regularly
* Use RBAC to restrict access to secrets
* Consider using sealed-secrets or external-secrets-operator for GitOps workflows
  {% endhint %}

### Example: Complete Observability Stack with Alertmanager

The following is a comprehensive example enabling the full observability stack with Alertmanager, custom alerting rules, and persistent storage:

```yaml
# full-observability-values.yaml
observability:
  enabled: true
  name: "t4k-observability"

  logging:
    loki:
      enabled: true
      fullnameOverride: "loki"
      singleBinary:
        replicas: 1
        persistence:
          enabled: true
          size: 20Gi
    promtail:
      enabled: true
      fullnameOverride: "promtail"

  monitoring:
    prometheus:
      enabled: true
      fullnameOverride: "prometheus"
      server:
        enabled: true
        fullnameOverride: "prometheus-server"
        persistentVolume:
          enabled: true
          size: 10Gi
        retention: "30d"

      # Enable kube-state-metrics for Kubernetes metrics
      kube-state-metrics:
        enabled: true

      # Enable node-exporter for node-level metrics
      prometheus-node-exporter:
        enabled: true

      alertmanager:
        enabled: true
        replicaCount: 1
        persistence:
          enabled: true
          size: 100Mi

        # Alertmanager configuration
        config:
          enabled: true
          global:
            slack_api_url: 'https://hooks.slack.com/services/YOUR/SLACK/WEBHOOK'
            resolve_timeout: 5m

          templates:
            - '/etc/alertmanager/*.tmpl'

          receivers:
            - name: 'default-receiver'
            - name: 'slack-critical'
              slack_configs:
                - channel: '#critical-alerts'
                  send_resolved: true
                  title: '[{{ .Status | toUpper }}] {{ .GroupLabels.alertname }}'
                  text: >-
                    {{ range .Alerts }}
                    *Alert:* {{ .Annotations.summary }}
                    *Description:* {{ .Annotations.description }}
                    *Severity:* {{ .Labels.severity }}
                    *Namespace:* {{ .Labels.namespace }}
                    {{ end }}
            - name: 'slack-warning'
              slack_configs:
                - channel: '#warning-alerts'
                  send_resolved: true

          route:
            group_by: ['alertname', 'namespace', 'severity']
            group_wait: 30s
            group_interval: 5m
            repeat_interval: 4h
            receiver: 'default-receiver'
            routes:
              - match:
                  severity: critical
                receiver: 'slack-critical'
              - match:
                  severity: warning
                receiver: 'slack-warning'

      # Custom alerting rules for T4K
      serverFiles:
        alerting_rules.yml:
          groups:
            - name: t4k-backup-alerts
              rules:
                # Alert when backup fails (metric value -1 indicates Failed/Error status)
                - alert: T4KBackupFailed
                  expr: trilio_backup_info == -1
                  for: 1m
                  labels:
                    severity: critical
                  annotations:
                    summary: "TrilioVault Backup Failed"
                    description: "Backup {{ $labels.backup }} has failed in namespace {{ $labels.resource_namespace }} on cluster {{ $labels.cluster }}"

                # Alert when backup is stuck in progress for too long
                - alert: T4KBackupStuck
                  expr: trilio_backup_info{status="InProgress"} == 0 and trilio_backup_status_percentage < 100
                  for: 60m
                  labels:
                    severity: warning
                  annotations:
                    summary: "TrilioVault Backup Stuck"
                    description: "Backup {{ $labels.backup }} has been in progress for more than 60 minutes in namespace {{ $labels.resource_namespace }}. Current progress: {{ $value }}%"

                # Alert when backup takes unusually long time
                - alert: T4KBackupDurationHigh
                  expr: trilio_backup_completed_duration > 120
                  for: 5m
                  labels:
                    severity: warning
                  annotations:
                    summary: "TrilioVault Backup Duration High"
                    description: "Backup {{ $labels.backup }} took {{ $value }} minutes to complete in namespace {{ $labels.resource_namespace }}"

            - name: t4k-restore-alerts
              rules:
                # Alert when restore fails
                - alert: T4KRestoreFailed
                  expr: trilio_restore_info == -1
                  for: 1m
                  labels:
                    severity: critical
                  annotations:
                    summary: "TrilioVault Restore Failed"
                    description: "Restore {{ $labels.restore }} has failed in namespace {{ $labels.resource_namespace }} on cluster {{ $labels.cluster }}"

                # Alert when restore is stuck
                - alert: T4KRestoreStuck
                  expr: trilio_restore_info{status="InProgress"} == 0 and trilio_restore_status_percentage < 100
                  for: 60m
                  labels:
                    severity: warning
                  annotations:
                    summary: "TrilioVault Restore Stuck"
                    description: "Restore {{ $labels.restore }} has been in progress for more than 60 minutes in namespace {{ $labels.resource_namespace }}"

            - name: t4k-target-alerts
              rules:
                # Alert when target is unavailable (metric value 0 indicates unavailable)
                - alert: T4KTargetUnavailable
                  expr: trilio_target_info == 0
                  for: 5m
                  labels:
                    severity: critical
                  annotations:
                    summary: "TrilioVault Target Unavailable"
                    description: "Target {{ $labels.target }} is not available in namespace {{ $labels.resource_namespace }}. Status: {{ $labels.status }}"

                # Alert when target storage exceeds threshold (example: 500GB)
                - alert: T4KTargetStorageHigh
                  expr: trilio_target_storage > 500000000000
                  for: 10m
                  labels:
                    severity: warning
                  annotations:
                    summary: "TrilioVault Target Storage High"
                    description: "Target {{ $labels.target }} storage usage is {{ $value | humanize1024 }}B in namespace {{ $labels.resource_namespace }}"

            - name: t4k-backupplan-alerts
              rules:
                # Alert when BackupPlan has no successful backups (not protected)
                - alert: T4KBackupPlanNotProtected
                  expr: trilio_backupplan_info{protected="False"} == 1
                  for: 24h
                  labels:
                    severity: warning
                  annotations:
                    summary: "TrilioVault BackupPlan Not Protected"
                    description: "BackupPlan {{ $labels.backupplan }} in namespace {{ $labels.resource_namespace }} has no successful backups for more than 24 hours"

                # Alert when BackupPlan fails
                - alert: T4KBackupPlanFailed
                  expr: trilio_backupplan_info == -1
                  for: 5m
                  labels:
                    severity: critical
                  annotations:
                    summary: "TrilioVault BackupPlan Failed"
                    description: "BackupPlan {{ $labels.backupplan }} has failed in namespace {{ $labels.resource_namespace }}"

            - name: t4k-continuous-restore-alerts
              rules:
                # Alert when ContinuousRestorePlan fails
                - alert: T4KContinuousRestorePlanFailed
                  expr: trilio_continuousrestoreplan_info == -1
                  for: 5m
                  labels:
                    severity: critical
                  annotations:
                    summary: "TrilioVault ContinuousRestorePlan Failed"
                    description: "ContinuousRestorePlan {{ $labels.continuousrestoreplan }} has failed on cluster {{ $labels.cluster }}"

                # Alert when ConsistentSet fails
                - alert: T4KConsistentSetFailed
                  expr: trilio_consistentset_info == -1
                  for: 5m
                  labels:
                    severity: critical
                  annotations:
                    summary: "TrilioVault ConsistentSet Failed"
                    description: "ConsistentSet {{ $labels.consistentset }} has failed for ContinuousRestorePlan {{ $labels.continuousrestoreplan }}"

  visualization:
    grafana:
      enabled: true
      fullnameOverride: "grafana"
      adminPassword: "your-secure-password"
      service:
        type: ClusterIP
```

Install with:

```bash
helm install tvm triliovault-operator/k8s-triliovault-operator -f full-observability-values.yaml
```

### Verifying Alertmanager Installation

After installation, verify that Alertmanager is running:

```bash
kubectl get pods -n <install_ns> | grep alertmanager

# Expected output:
# <release name>-alertmanager-0                                             1/1     Running            0          2m
```

Access the Alertmanager UI:

```bash
# Port forward to access locally
kubectl port-forward svc/alertmanager -n <install_ns> 9093:9093
```

Then open your browser to `http://localhost:9093` to view the Alertmanager UI.

## T4K Metrics Reference

Trilio for Kubernetes (T4K) exports Prometheus metrics through the `k8s-triliovault-exporter` component. These metrics can be used for monitoring, alerting, and dashboarding.

### Metric Value Conventions

For status-based metrics (`*_info` metrics), the numeric value indicates the status:

| Status                    | Metric Value | Description                    |
| ------------------------- | ------------ | ------------------------------ |
| `Available` / `Completed` | `1`          | Resource is healthy/successful |
| `Failed` / `Error`        | `-1`         | Resource has failed            |
| `InProgress`              | `0`          | Operation is in progress       |
| Empty/Unknown             | `-2`         | Status not yet determined      |

### Available Metrics

#### Backup Metrics

<table><thead><tr><th width="309">Metric Name</th><th>Description</th><th>Key Labels</th></tr></thead><tbody><tr><td><code>trilio_backup_info</code></td><td>Backup status and metadata</td><td><code>backup</code>, <code>backupplan</code>, <code>resource_namespace</code>, <code>status</code>, <code>target</code>, <code>backup_type</code>, <code>start_ts</code>, <code>completion_ts</code>, <code>size</code>, <code>cluster</code>, <code>kind</code>, <code>hook</code>, <code>backupscope</code>, <code>applicationtype</code></td></tr><tr><td><code>trilio_backup_storage</code></td><td>Backup size in bytes</td><td><code>backup</code>, <code>backupplan</code>, <code>resource_namespace</code>, <code>status</code>, <code>target</code>, <code>backup_type</code>, <code>cluster</code>, <code>kind</code></td></tr><tr><td><code>trilio_backup_status_percentage</code></td><td>Backup progress (0-100)</td><td><code>backup</code>, <code>backupplan</code>, <code>resource_namespace</code>, <code>status</code>, <code>target</code>, <code>backup_type</code>, <code>cluster</code>, <code>kind</code></td></tr><tr><td><code>trilio_backup_completed_duration</code></td><td>Backup duration in minutes (only for completed backups)</td><td><code>backup</code>, <code>backupplan</code>, <code>resource_namespace</code>, <code>status</code>, <code>target</code>, <code>backup_type</code>, <code>cluster</code>, <code>kind</code></td></tr><tr><td><code>trilio_backup_metadata_info</code></td><td>Detailed backup object metadata</td><td><code>backup</code>, <code>backupplan</code>, <code>resource_namespace</code>, <code>status</code>, <code>objecttype</code>, <code>objectname</code>, <code>backupscope</code>, <code>applicationtype</code>, <code>apiversion</code>, <code>apigroup</code>, <code>object_resource</code></td></tr></tbody></table>

#### Restore Metrics

<table><thead><tr><th width="305">Metric Name</th><th>Description</th><th>Key Labels</th></tr></thead><tbody><tr><td><code>trilio_restore_info</code></td><td>Restore status and metadata</td><td><code>restore</code>, <code>backup</code>, <code>backupplan</code>, <code>resource_namespace</code>, <code>status</code>, <code>target</code>, <code>size</code>, <code>start_ts</code>, <code>completion_ts</code>, <code>cluster</code>, <code>kind</code></td></tr><tr><td><code>trilio_restore_status_percentage</code></td><td>Restore progress (0-100)</td><td><code>restore</code>, <code>backup</code>, <code>resource_namespace</code>, <code>status</code>, <code>target</code>, <code>cluster</code>, <code>kind</code></td></tr><tr><td><code>trilio_restore_completed_duration</code></td><td>Restore duration in minutes (only for completed restores)</td><td><code>restore</code>, <code>backup</code>, <code>resource_namespace</code>, <code>status</code>, <code>target</code>, <code>cluster</code>, <code>kind</code></td></tr></tbody></table>

#### Target Metrics

| Metric Name             | Description                                             | Key Labels                                                                                                                                          |
| ----------------------- | ------------------------------------------------------- | --------------------------------------------------------------------------------------------------------------------------------------------------- |
| `trilio_target_info`    | Target availability status (1=available, 0=unavailable) | `target`, `resource_namespace`, `status`, `vendor`, `vendorType`, `browsing`, `eventTarget`, `size`, `threshold_capacity`, `creation_ts`, `cluster` |
| `trilio_target_storage` | Storage used by target in bytes                         | `target`, `resource_namespace`, `status`, `vendor`, `vendorType`, `threshold_capacity`, `creation_ts`, `cluster`                                    |

#### BackupPlan Metrics

| Metric Name                  | Description                          | Key Labels                                                                                                                                                               |
| ---------------------------- | ------------------------------------ | ------------------------------------------------------------------------------------------------------------------------------------------------------------------------ |
| `trilio_backupplan_info`     | BackupPlan status and summary        | `backupplan`, `resource_namespace`, `status`, `target`, `protected`, `backup_count`, `lastprotected`, `backupscope`, `applicationtype`, `creation_ts`, `cluster`, `kind` |
| `trilio_backupplan_crstatus` | BackupPlan continuous restore status | `backupplan`, `continuousrestoreinstance`, `continuousrestore_enabled`, `continuousrestoreplan`, `consistentset_count`, `cr_status`, `cluster`, `kind`                   |

#### Continuous Restore Metrics

<table><thead><tr><th width="355">Metric Name</th><th>Description</th><th>Key Labels</th></tr></thead><tbody><tr><td><code>trilio_continuousrestoreplan_info</code></td><td>ContinuousRestorePlan status</td><td><code>continuousrestoreplan</code>, <code>continuousrestorepolicy</code>, <code>target</code>, <code>consistentsetcount</code>, <code>sourcebackupplan</code>, <code>sourceinstanceinfo</code>, <code>status</code>, <code>creation_ts</code>, <code>cluster</code>, <code>kind</code></td></tr><tr><td><code>trilio_consistentset_info</code></td><td>ConsistentSet status and details</td><td><code>consistentset</code>, <code>consistentsetscope</code>, <code>continuousrestoreplan</code>, <code>sourcebackupplan</code>, <code>sourceinstanceinfo</code>, <code>backupName</code>, <code>backupNamespace</code>, <code>backupStatus</code>, <code>backupSize</code>, <code>status</code>, <code>size</code>, <code>cluster</code>, <code>kind</code></td></tr><tr><td><code>trilio_consistentset_status_percentage</code></td><td>ConsistentSet progress (0-100)</td><td><code>consistentset</code>, <code>consistentsetscope</code>, <code>continuousrestoreplan</code>, <code>sourcebackupplan</code>, <code>sourceinstanceinfo</code>, <code>backupName</code>, <code>status</code>, <code>cluster</code>, <code>kind</code></td></tr><tr><td><code>trilio_consistentset_completed_duration</code></td><td>ConsistentSet duration in minutes</td><td><code>consistentset</code>, <code>consistentsetscope</code>, <code>continuousrestoreplan</code>, <code>sourcebackupplan</code>, <code>sourceinstanceinfo</code>, <code>backupName</code>, <code>status</code>, <code>cluster</code>, <code>kind</code></td></tr></tbody></table>

### Example PromQL Queries

```promql
# Count of failed backups by namespace
count(trilio_backup_info == -1) by (resource_namespace)

# List all successful backups
trilio_backup_info{status="Available"}

# Total backup storage per target
sum(trilio_backup_storage) by (target)

# Average backup duration by backupplan
avg(trilio_backup_completed_duration) by (backupplan)

# Unavailable targets
trilio_target_info == 0

# BackupPlans without successful backups
trilio_backupplan_info{protected="False"}

# Failed restores in last 24 hours
trilio_restore_info == -1

# ContinuousRestorePlan replication lag (ConsistentSets in progress)
trilio_consistentset_info{status="InProgress"}
```

### Viewing Alert Rules in Grafana

Once alert rules are configured, you can view and manage them directly from the Grafana UI. Navigate to **Alerting > Alert rules** to see all configured rules, their current state, and firing alerts.

<figure><img src="/files/wAJG9d0Yivth9YF2kJQr" alt=""><figcaption></figcaption></figure>

The Alert rules page shows:

* **Data source-managed rules**: Alert rules defined in Prometheus configuration (e.g., `/etc/config/alerting_rules.yml`)
* **State**: Current state of each alert (Firing, Normal, Pending, Recovering)
* **Health**: Health status of the alert rule
* **Summary**: Brief description of what the alert monitors

You can filter alerts by data source, dashboard, state, rule type, health status, and contact point.

### View Logs From T4K UI

* Login to T4K UI with preferred authentication
* Select "Launch Event Viewer" on any required service or application

<figure><img src="/files/VNqGt0w5DfmsNahqEM4f" alt=""><figcaption><p>Launch Event Viewer option</p></figcaption></figure>

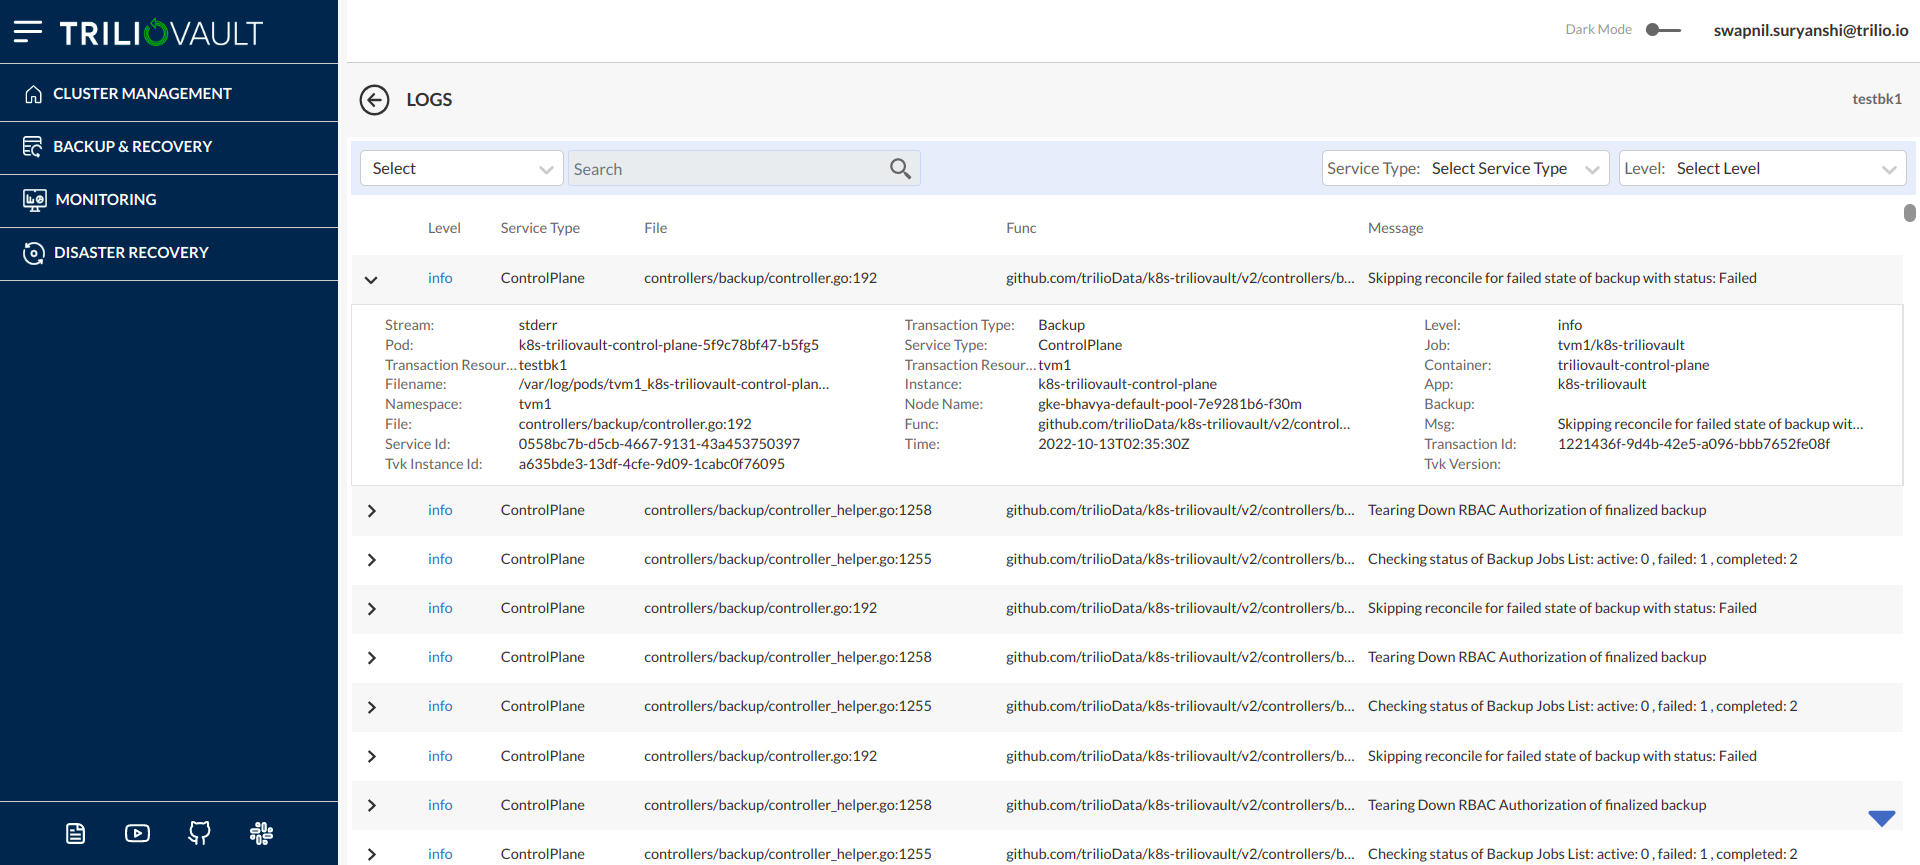
* On click on "Launch Event Viewer" option, user will be redirected to Logs visibility page.

<figure><img src="/files/lP8M4w2mKUFYL4PiNCWq" alt=""><figcaption><p>Logs page</p></figcaption></figure>

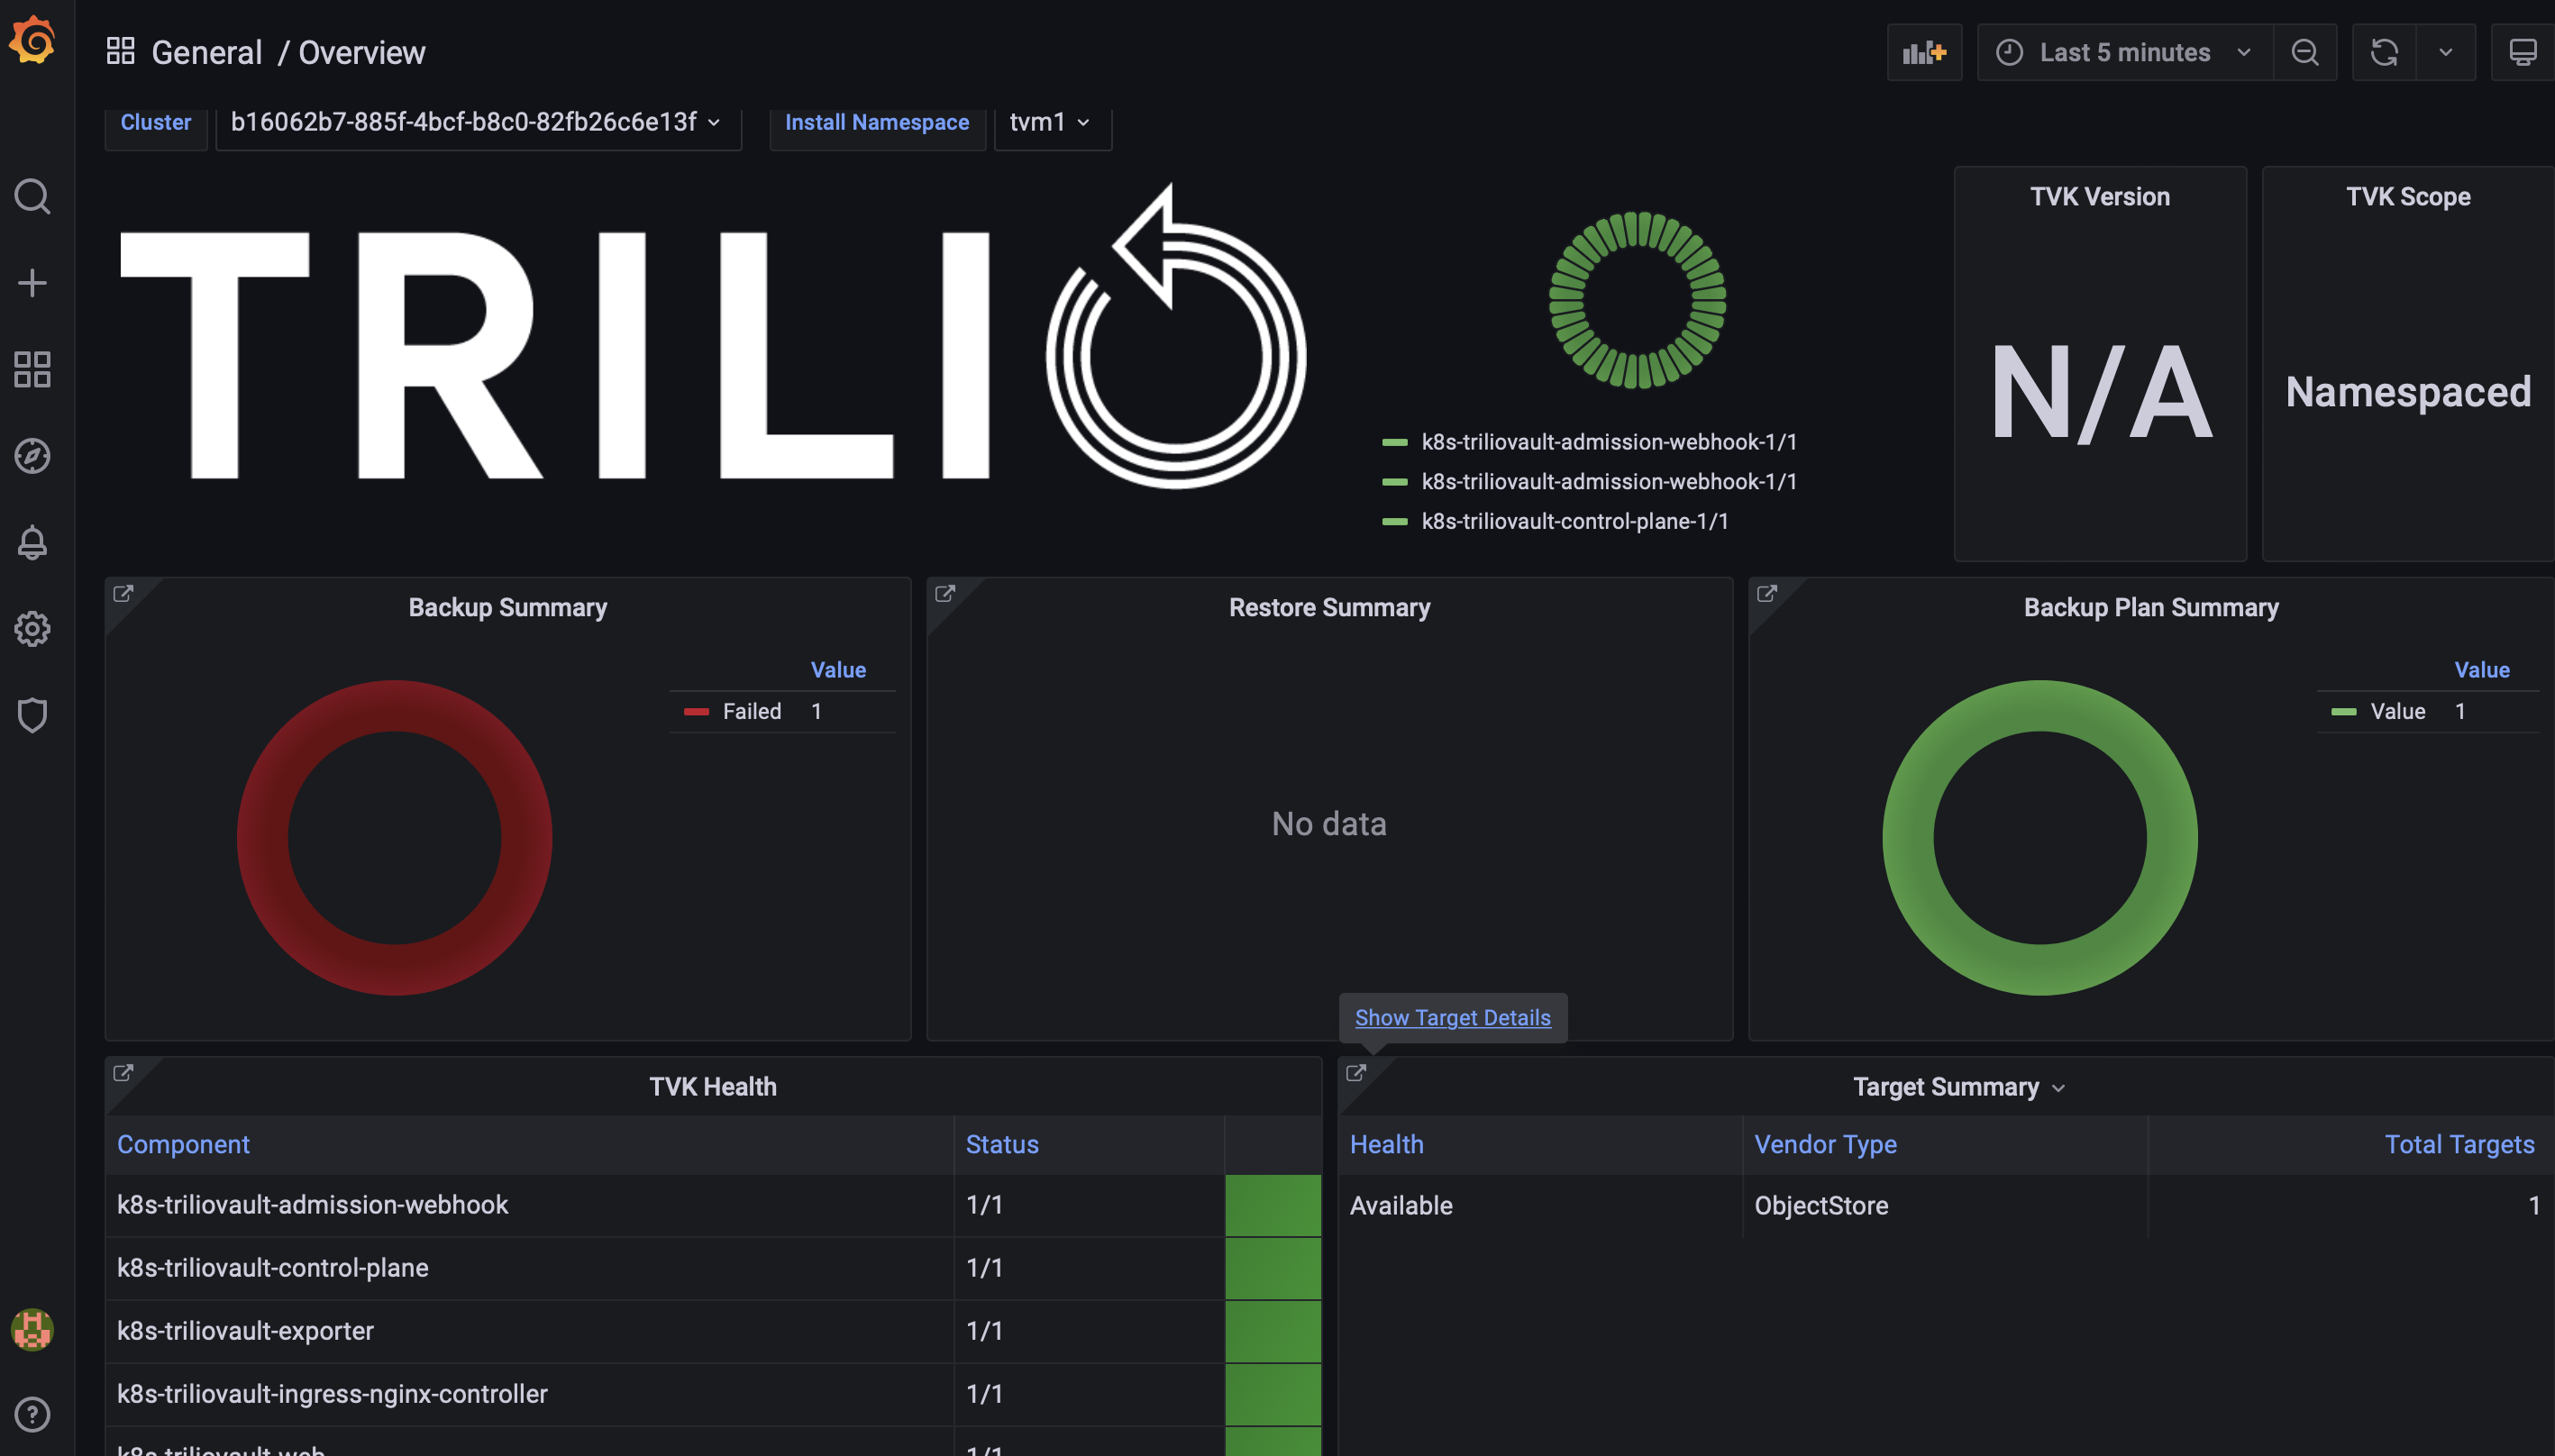
### Accessing Grafana Dashboards

```
Grafana Endpoint : http://<T4K_IP>/grafana

Login with default grafana credentials.
username: admin
password: admin123
```

{% hint style="info" %}
if a custom path is configured then:

Grafana Endpoint : http\://\<T4K\_IP>/\<custom-path>/grafana
{% endhint %}

<figure><img src="/files/VLoQmA4eWxpvLEo8up1F" alt=""><figcaption></figcaption></figure>

## Additional Monitoring Components

### Kube-State-Metrics

Kube-state-metrics generates metrics about the state of Kubernetes objects. Enable it to get comprehensive cluster metrics:

```yaml
observability:
  enabled: true
  monitoring:
    prometheus:
      kube-state-metrics:
        enabled: true
```

### Node Exporter

Node Exporter exposes hardware and OS metrics from the host machines:

```yaml
observability:
  enabled: true
  monitoring:
    prometheus:
      prometheus-node-exporter:
        enabled: true
```

### Pushgateway

Pushgateway allows ephemeral and batch jobs to expose metrics to Prometheus:

```yaml
observability:
  enabled: true
  monitoring:
    prometheus:
      prometheus-pushgateway:
        enabled: true
```


---

# Agent Instructions: Querying This Documentation

If you need additional information that is not directly available in this page, you can query the documentation dynamically by asking a question.

Perform an HTTP GET request on the current page URL with the `ask` query parameter:

```
GET https://docs.trilio.io/kubernetes/configuration/observability/t4k-integration-with-observability-stack.md?ask=<question>
```

The question should be specific, self-contained, and written in natural language.
The response will contain a direct answer to the question and relevant excerpts and sources from the documentation.

Use this mechanism when the answer is not explicitly present in the current page, you need clarification or additional context, or you want to retrieve related documentation sections.